
lenskart solutions private limited
Enquiry
About Lenskart Solutions Private Limited
Founded in 2010, By an ex-Microsoft 'techie' with no money but truckloads of relentless passion to make a difference in this world, Lenskart is one of the fastest growing eyewear business today.
Peyush along with his two co-founders Amit Chaudhary and Sumeet Kapahi founded 'VALYOO technologies'. The aim was to truly add 'valyoo' in customers' lives by eliminating the retailers, setting up our own high quality manufacturing and supplying directly to the consumer. With this, they not only cuts costs, but also delivered high quality standards, supported with in house robotic lens manufacturing and assembly ensuring 100% precision and top quality control.
With a rapidly growing business reaching out to over 1,00,000 customers a month via a unique combination of a strong online business and uniquely designed physical stores, Lenskart is revolutionizing the eyewear industry.
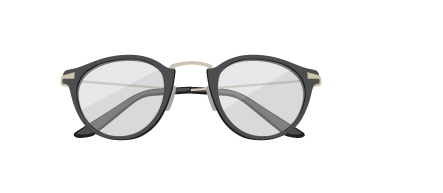
GREAT QUALITY
Made by robots
We are India's first and the only brand to use robotic technique that delivers glasses which are accurate to 3 decimal places. These machines imported from Germany, ensure perfection on all front: an automated system that allows to inspect lenses, determine the geometric center, and load the lenses for edging without the need of a finishing block.
Mind of machine
Our people have zero tolerance to error and our call center aims to delight every customer, solve their problems and work on their feedbacks.
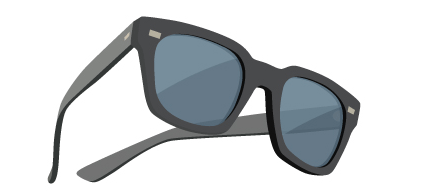
VARIETY
- We let the numbers talk.
- We have over 5000 styles of eyewear, which is 5 times more than that any retailer in India. From big brands like RayBan and Oakley to the best in house brands.

- An eye for an eye
- From sunglasses to reading glasses to contact lenses, we make everything that can help you see this beautiful world with more clarity.
- We got the whole world
- Yes it is true make eyewear for men, women, kids, for all humans of the world.
- All covered
- We have it all. everyday basics. Everyday fashion. Evening wear. Not just that, we update our styles every year to keep up with fashion trends around the globe, taking inspiration from fashion capitals and the best designers of the world.
VALUE FOR MONEY
- Not all good things in the world are expensive
- Our prices are lower than any of your local optician. Our customers can find the most attractive packages on contact lenses
- No middle man.No extra cost.
- No middleman simply means no middle ground. Our products come straight from the manufacturer, hence getting rid of all extra costs and burden.

| Lenskart Solutions Private Limited Price | 450 |
| Lot Size | 100 |
| 52 Week High | 460 |
| 52 Week Low | 300 |
| Depository | NSDL & CDSL |
| PAN Number | AACCV7324B |
| ISIN Number | INE956O01016 |
| CIN | U33100DL2008PTC178355 |
| RTA | MUFG Intime India |
| Market Cap (in cr.) | 50430 |
| P/E Ratio | 169.49 |
| P/B Ratio | 8.12 |
| Debt to Equity | 0.06 |
| ROE (%) | 4.79 |
| Book Value | 36.93 |
| Face Value | 2 |
| Total Shares | 1681015590 |
Financials
| P&L Statement | 2022 | 2023 | 2024 | 2025 |
|---|---|---|---|---|
| Revenue | 1503 | 3788 | 5428 | 6653 |
| Cost of Material Consumed | 617 | 1400 | 1830 | 2218 |
| Gross Margins | 58.95 | 63.04 | 66.29 | 66.66 |
| Change in Inventory | -18 | -32 | -54 | -83 |
| Employee Benefit Expenses | 245 | 717 | 1086 | 1379 |
| Other Expenses | 772 | 1439 | 1892 | 2164 |
| EBITDA | -113 | 264 | 674 | 975 |
| OPM | -7.52 | 6.97 | 12.42 | 14.66 |
| Other Income | 121 | 140 | 181 | 352 |
| Finance Cost | 23 | 83 | 123 | 146 |
| D&A | 85 | 417 | 672 | 797 |
| EBIT | -198 | -153 | 2 | 178 |
| EBIT Margins | -13.17 | -4.04 | 0.04 | 2.68 |
| PBT | -102 | -97 | 59 | 385 |
| PBT Margins | -6.79 | -2.56 | 1.09 | 5.79 |
| TAX | 0 | -37 | 69 | 88 |
| PAT | -102 | -60 | -10 | 297 |
| NPM | -6.79 | -1.58 | -0.18 | 4.46 |
| EPS | -6.77 | -3.69 | -0.11 | 3.85 |
| Financial Ratios | 2022 | 2023 | 2024 | 2025 |
| Operating Profit Margin | -7.52 | 6.97 | 12.42 | 14.66 |
| Net Profit Margin | -6.79 | -1.58 | -0.18 | 4.46 |
| Earning Per Share (Diluted) | -6.77 | -3.69 | -0.11 | 3.85 |